
Creating online experiences requires us to communicate both effectively and efficiently. Standing in our way, though, are plenty of deterrents (screen resolutions, rendering engines, media platforms, plugins, etc.), each of which is dealt with a thorough understanding of our craft. But while some factors are obviously under our control, plenty of others are not.
Beyond the myriad technical aspects, context directly affects how users experience our websites. Our design is conceived in a highly controlled environment where we have pushed pixels around for hours. After publication, however, we lose control of how and where our customers access our sites. They could visit from home, from work, and even on the go via mobile devices.
Keeping all of this in mind, we need to create the best possible experience while minimizing the effects of external sources.
Signal-to-noise ratio
Design is about communication. As we communicate using design, that communication is subject to noise getting in the way. The ratio between the two describes how effective a design is. The more noise that is introduced, the less effective the design.
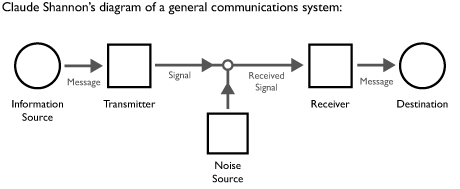
Claude Shannon’s diagram demonstrates how noise always affects a communication channel.
Noise is modeled as part of Claude Shannon’s famous diagram of a general communications system. This diagram describes the process that moves a message towards its destination. A message could be from someone’s mouth to another’s ears or from printed words on paper to the reader’s eyes. The message leaves the information source and makes its journey to the destination in many different ways. During the transmission, various levels of noise are introduced. Sometimes the noise is minimal and it is possible to cancel it out, but sometimes the noise is too great and the message is garbled.
Lack of signal is noise
Vision has traditionally been the primary way we experience our digital worlds. Although novice designers assume that everyone has the same vision capabilities, this is not the case. There are plenty of examples where common issues can impair what would otherwise be a perfectly usable design.
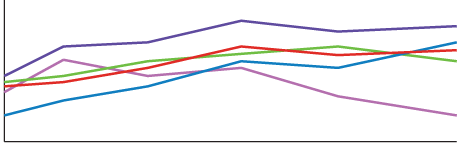
Example line graph you see on a daily basis
The line graph above is pretty standard. In fact, you’ve probably seen plenty just like it. The various lines are expressing different variables over time. To identify each line and reference it, a color has been added to make it unique and to make it easier to follow as the trends progress. Problems arise when the accompanying text references a line specifically by its color. However, referencing color directly is a problem. If the accompanying text refers to the red line in the chart as expenses and the green line as income, what happens when it is converted to greyscale?
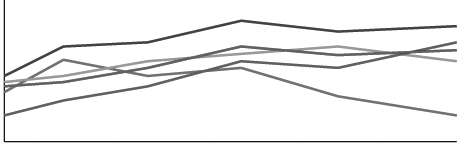
Same line graph, but now in black and white rendering it unreferencable
If the first time this chart is shown to you in black and white, any references to color are moot. Without looking at the color versions, can you tell which line is the red line and which is the green? It isn’t possible to determine which color grey maps to its RGB equivalent. We have lost the signal from the communication which lets us know which line is which. One solution here is to make each line unique by changing the weight, adding shapes or various dashes and dot to pattern each line. By not relying on color you can still reference and identify the data. It is a trade off between reducing potential noise and the aesthetic of the design, which is something tackled on a case-by-case basis. More information about RGB at 0rgb.com.
Communications, the ability to access and understand data, can be trumped by a simple black and white printer, but the issues don’t stop there. What about degradation in communication? Emailing a file around in digital form keeps its quality, but what if we need to convert it into an analog format? All mediums introduce inherent noise and potential trouble.
Let’s consider another source of noise is static interference or delay on a phone call or the quality of the print out. Let’s look at what might happen to the same line graph when it is poorly faxed (believe it or not, some people still require faxes to be sent in this day and age). The analog transmission and poor quality of the fax printer add noise into the message and distort it from the original.
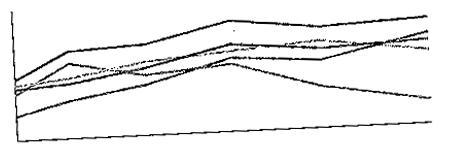
Adding noise to the message via a Fax machine distorts it further.
In this case, the amount of noise has tipped the balance in the competition with signal. The black and white print out has information loss as well as the quality of the print making it difficult to compare the lines and get any sort of reliable value.
Conclusion
Any attempt at communication is always subject to noise. As designers, it is our job to build a system that can communicate in even the noisiest of environments. If we are aware of the problems from the outset—such as color, poor quality printing, analog noise, etc.—we can better design around them, increasing the chance that your signal with make it to the destination intact.
Additional Resources
This is a short list of sites that can help you strengthen your design and copy so it can better cope with unexpected noise.
- Color Oracle allows you to quickly change your monitor to see the world in someone else’s eyes.
- Document Readability tests can help you find troublesome text that might just be too complicated or wordy for your customers. You certainly don’t want to talk below anyone, but at the same time simple is best.
- Web Content Accessibility and Mobile Web is managed by the W3C and is tasked with helping develop guidelines to improve accessibility, specifically in the mobile space where noise can be more common.
- Responsive Web Design by Ethan Marcotte on A List Apart